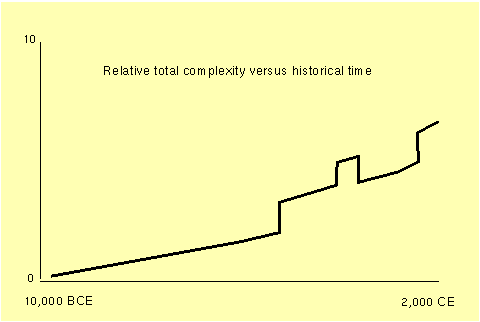
Histocomplexity verseus time graph
Here the time range (horizontal axis) corresponds to grades 4-11 at the Ross School. The histocomplexity range (vertical axis) is labelled in arbitrary units. Only time-averaged values are shown in the graph, which otherwise would jump about wildly, like stock indices.
yes, those jumps are... bifurcations!!!
well, at least evidence of bifurcations...
Revised 14 November 2000 by Ralph Herman Abraham