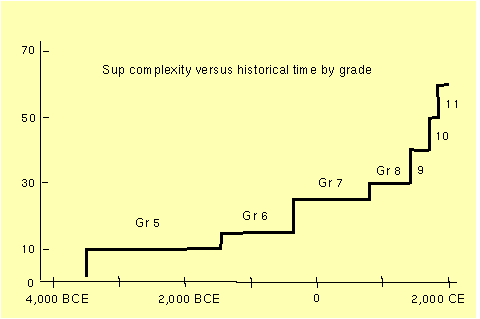
Supcomplexity versus grade graph
Here the time range (horizontal axis) corresponds to grades 5-11 at the Ross School, and is blocked according to grade level. The histocomplexity range (vertical axis) is labelled in arbitrary units. Only maximum values (supcomplexity) are shown in the graph, which provides a standard range accomodating all values that might be encountered in the time-frame of that grade. (In mathspeak, the supcomplexity of a grade is the supremum of the histocomplexity over the time-frame of that grade.)
NOTE: The quantum leaps upward in supcomplexity for each grade look like evidence for bifurcations in cultural history. And they are, for a promotion in grade is major bifurcation in the life of a student, and we have intentionally matched these personal jumps with major bifurcation events in world cultural history.
Revised 14 November 2000 by Ralph Herman Abraham